Project 2
Project 2 examines the effect of movement-based restrictions on mobility in Nigeria and South Africa, comparing pre-pandemic and post-pandemic patterns in cell phone mobility data and connecting specific movement patterns with Covid-19 risk. This model incorporates state-of-the-art mobility analytics from the transportation sector, applying them to the African context, possibly for the first time.
PRINCIPAL INVESTIGATOR

Chenfeng Xiong, PhD
Chenfeng Xiong is an assistant Professor at the Department of Civil and Environmental Engineering, Villanova University. He holds a Bachelor’s degree in Civil Engineering from Tsinghua University, and an M.S degree in Civil Engineering, an M.A in Economics and a Ph.D in Transportation Engineering, from the University of Maryland. Chenfeng’s areas of interest include, transportation big data, human mobility and travel behavior modeling, transportation economics, carbon neutralization, large-scale agent-based analysis modeling and simulation (AMS). As a researcher, Chenfeng has published over 80 peer reviewed articles.
Dr. Xiong also leads one of the INFORM Africa pilot projects and currently serves as the Chairperson for the DSI-Africa steering committee.
TEAM MEMBERS


ACTIVITIES
The Project 2 Research Team employs mobile device location data and developed in-house big-data and data-driven algorithms to analyse human mobility, activities, and population density in South Africa and Nigeria in pandemic situations. The team’s cloud-based big-data computing infrastructure ingests terabytes of data daily and produces high-resolution human mobility measurements.
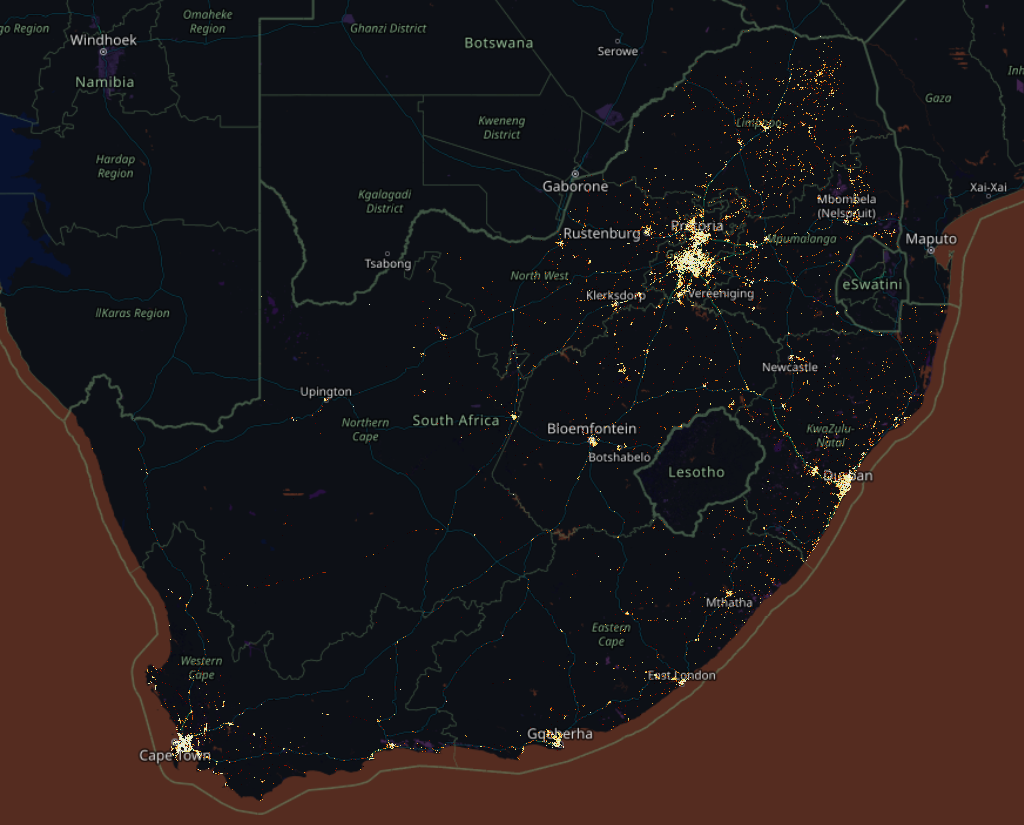
Density Plot of 14 Days of Human Activities in South Africa
The mobility measurements produced by the team are new and have filled a major data gap in understanding the travel behaviour change during the SARS-CoV-2 in Nigeria and South Africa. The team assessed the effectiveness of mobility restricting policies as key lessons learned from the pandemic and found that travel bans, and federal lockdown policies failed to restrict trip-making behaviour but had a significant impact on distance travelled.
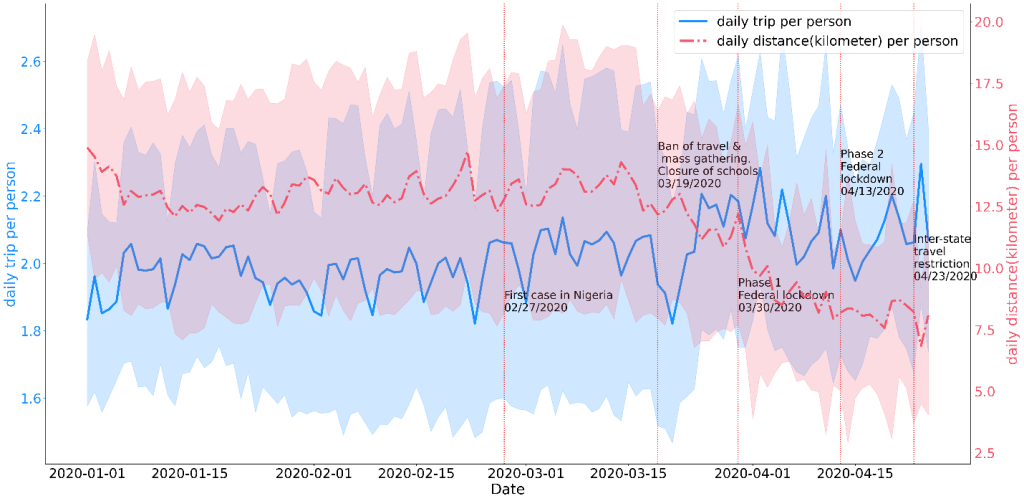
Daily trips per person and daily distance travelled per person measured using smartphone location data collected in Nigeria (January 01, 2020 – April 25, 2020).
Using the developed analytical framework in the previous project years, the team has produced individual-level trip rosters. The roster information was used to calculate the metrics of three types of human mobilities (shown in Figure 1), including provincial inflows, cross-district flows, and within-district flows, for all provinces in South Africa. These metrics were used to evaluate the dynamic impacts of three types of human mobilities on daily reported Covid-19 cases for 2020.
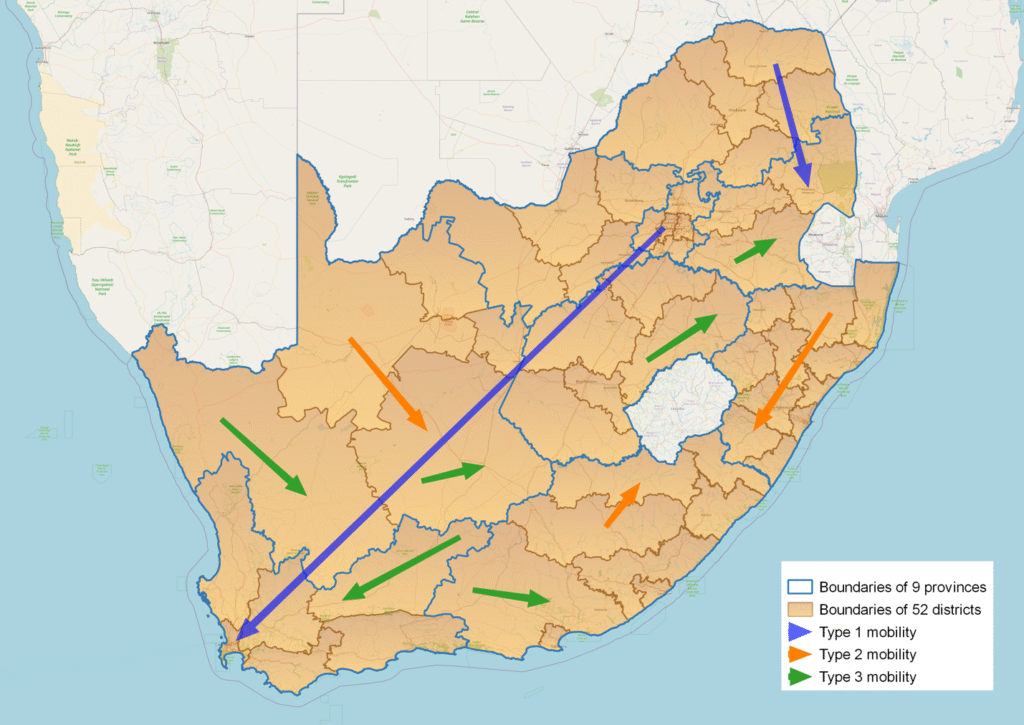
Figure 1-(a): illustration of 3 types of human mobility flow
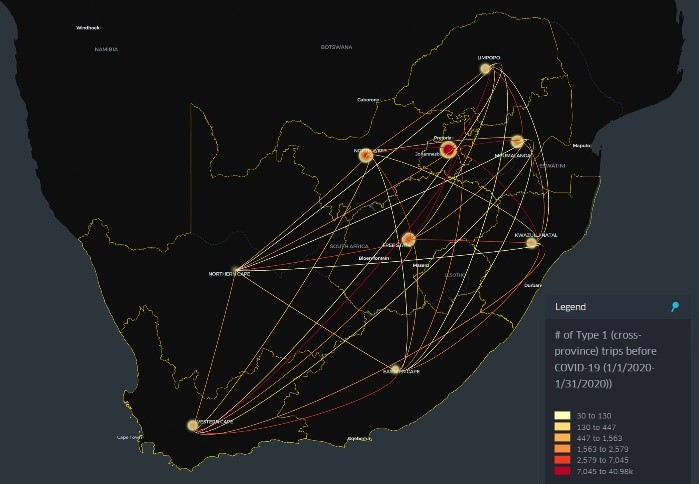
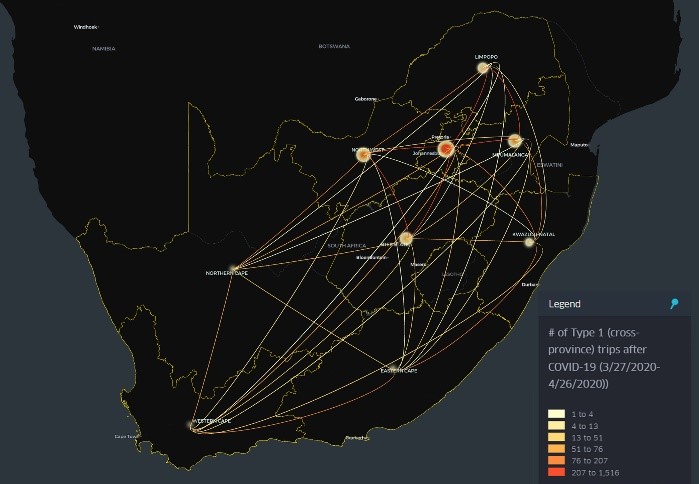
Figure 1-(b): # of Type 1 trips. Before & After Covid-19 comparison

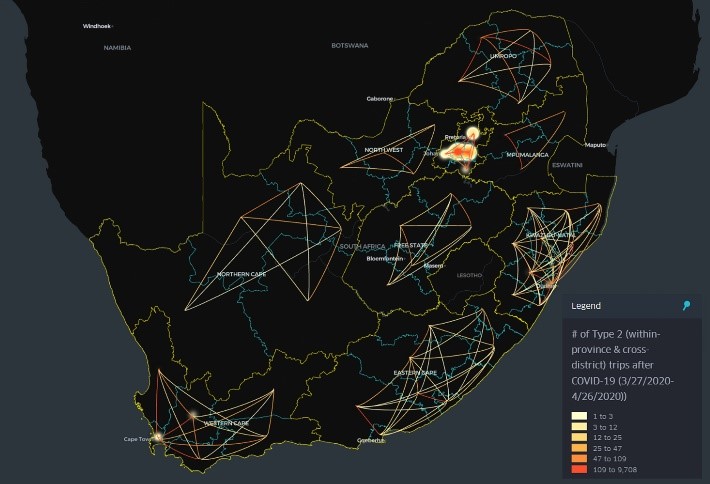
Figure 1-(c): # of Type 2 trips. Before & After Covid-19 comparison
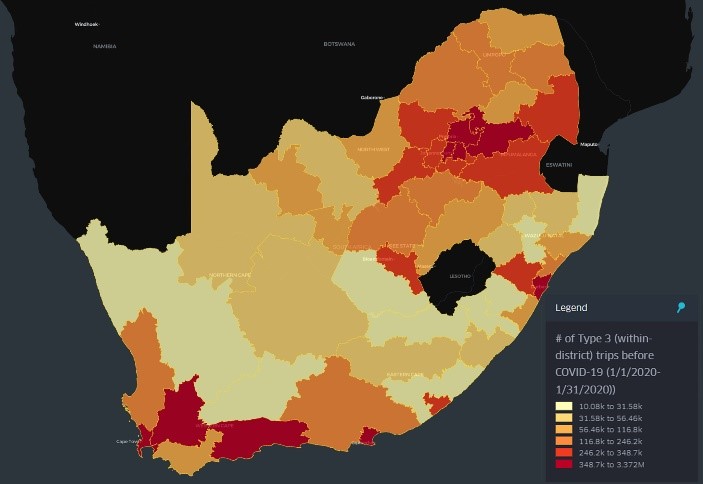
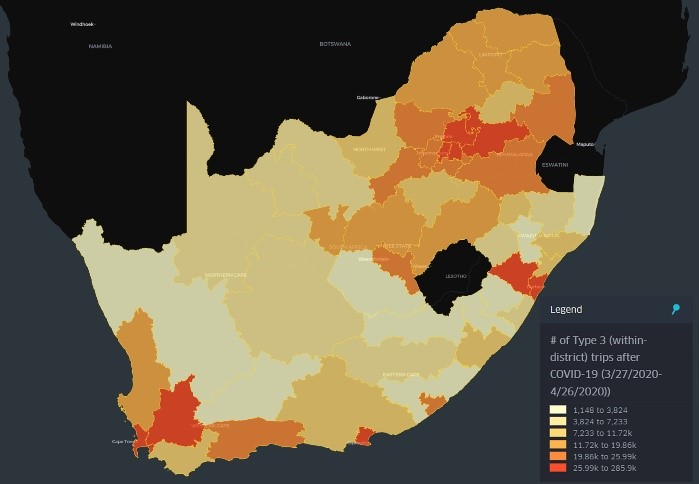
Figure 1-(d): # of Type 3 trips. Before & After Covid-19 comparison
The team built a structural equation model at province-level of South Africa to analyze the impact of three types of mobility metrics on Covid-19. The varying patterns of the metrics are shown in Figure 2.
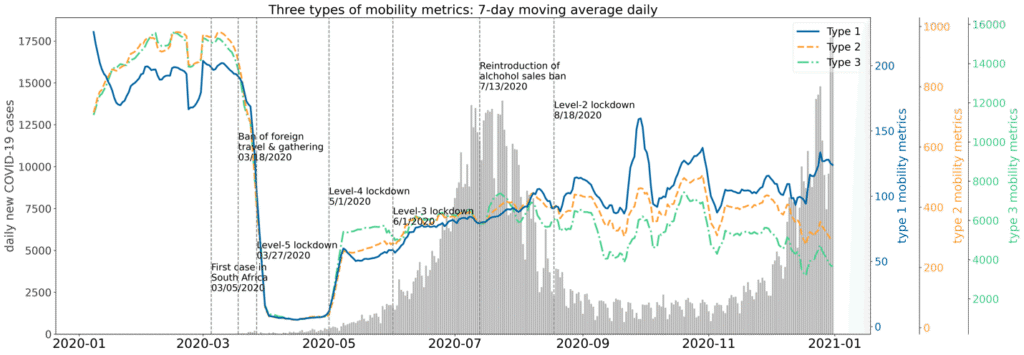
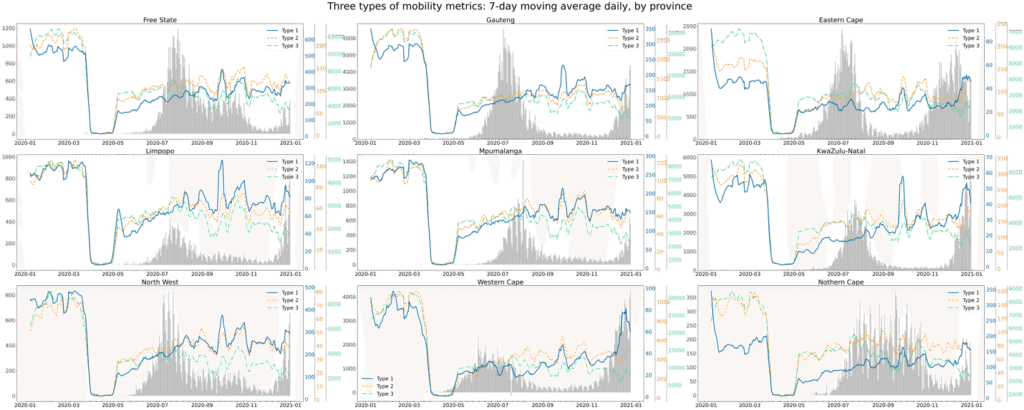
Figure 2: (a) Varying pattern of the three types of mobility metrics of South Africa (weighted average by province population) and daily reported new Covid-19 cases from March 5th 2020 to December 31st 2020. (b) Separated by provinces of South Africa.
Through our dynamic structural equation model, we observed that at the emergent stage of the pandemic, the government policy of South Africa played an important role in guiding people’s travel behavior. However, on May 1st, the lockdown level was lowered from level-5 to level-4, we observed that the impact of the level-4 lockdown policy on people’s travel behavior became extremely limited, It shows that the acceptance of the travel restriction policy was substantially decreased among the people. We believe it can be attributed to the reaction of people’s fatigue to the social distancing as people have been restricted at home for a long time.
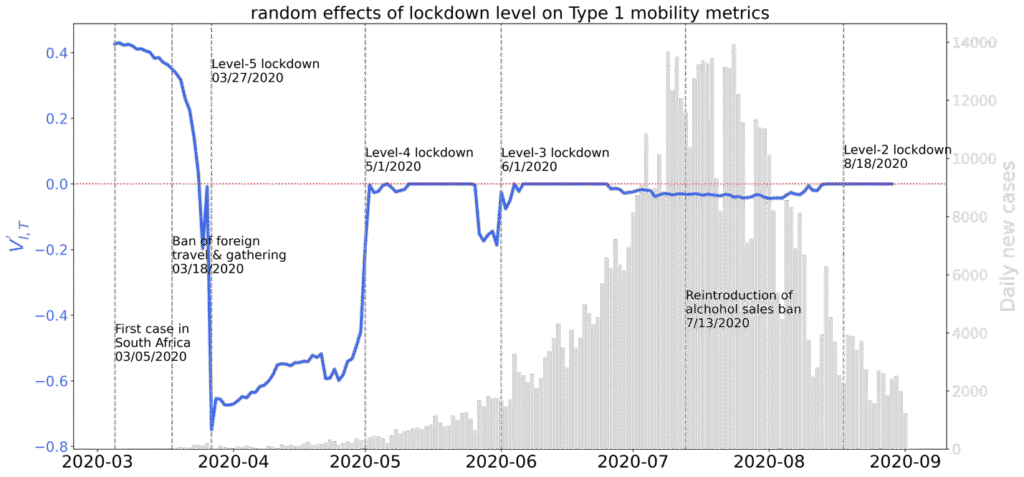
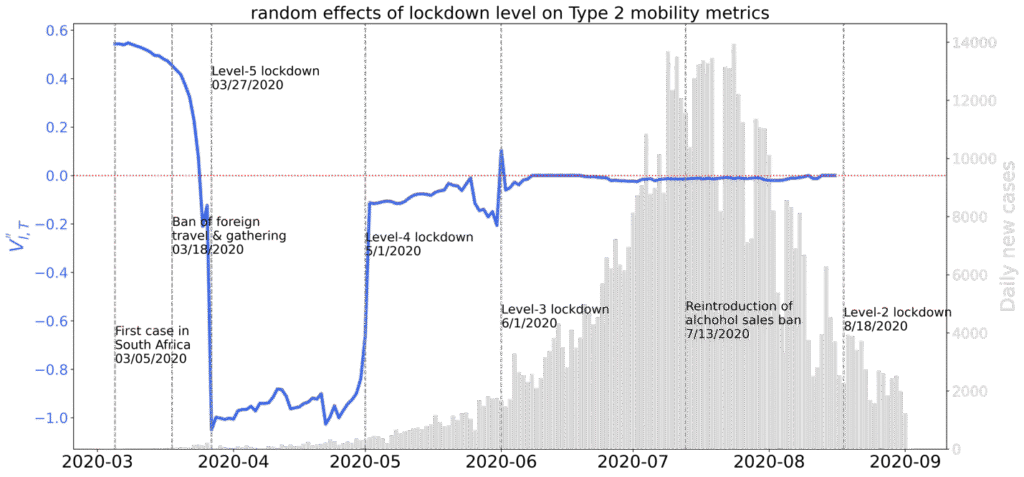
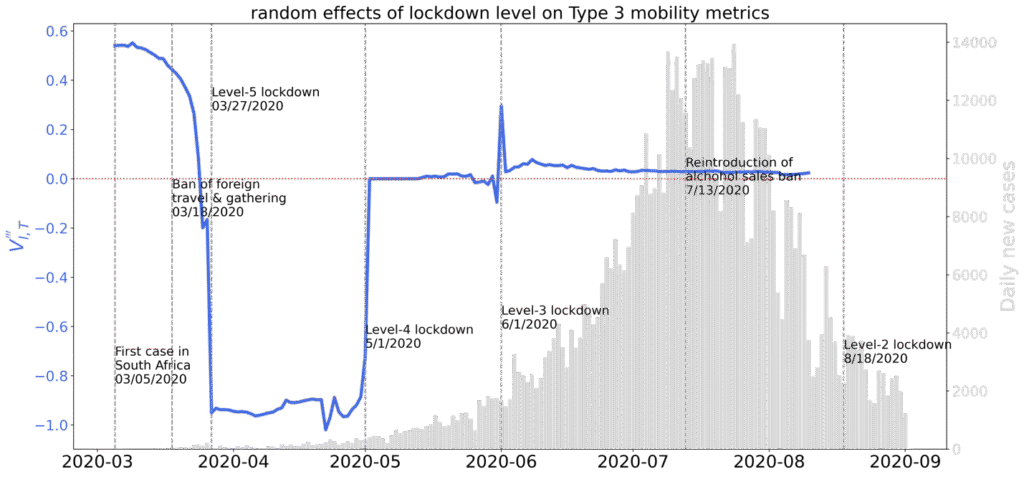
Figure 3: Random effects of lockdown level on natural-logged three types of mobility metrics
The team has built a structural equation model at province-level of South Africa to analyze the impact of three types of mobility metrics on Covid-19. The team incorporated origin-destination information into the three types of mobility metrics and captured their time-varying impact on the daily new cases. Through using the three types of human mobilities demonstrated in Aim 1, the dynamic relationships are shown as follows in Figure 4.
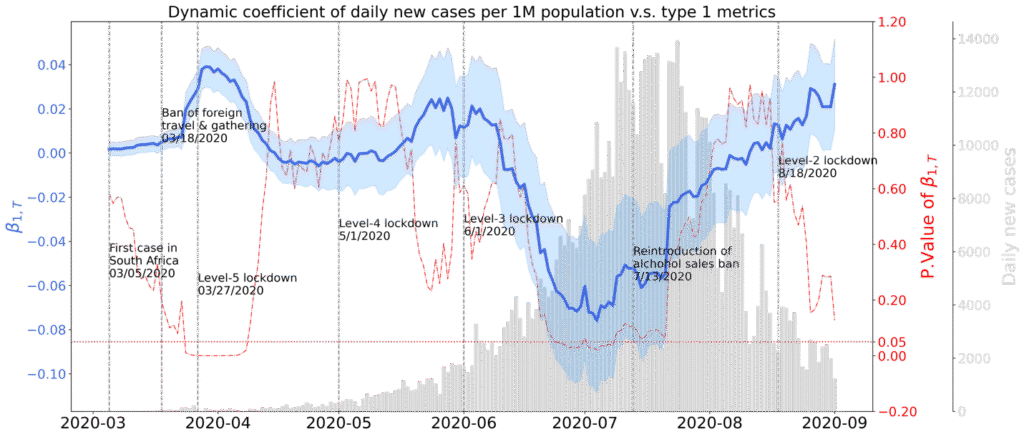
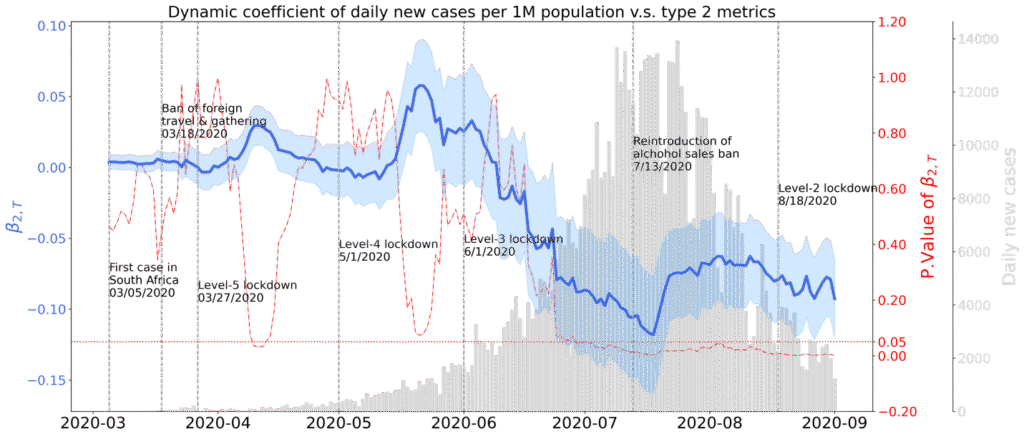
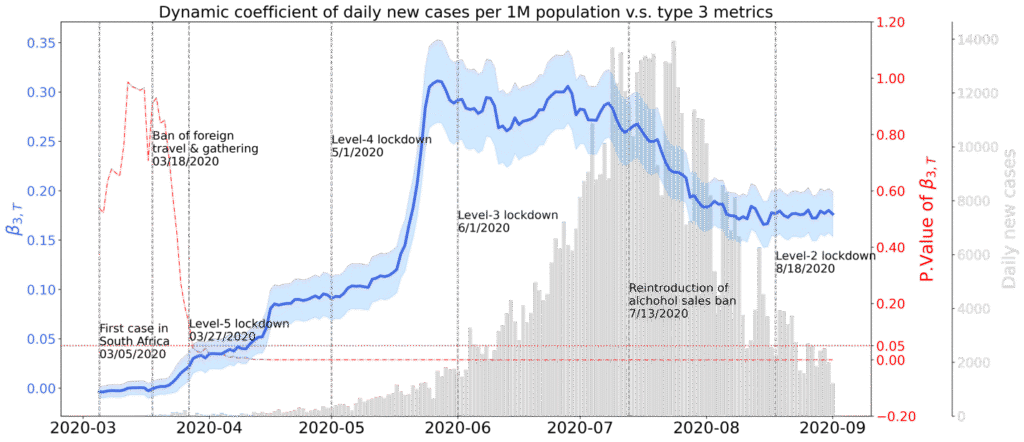
Figure 4: Dynamic coefficients between daily new Covid-19 cases per 1 million population and Type 1, 2, or 3 mobility metrics
We observed alternating and overlapping impacts from the three mobility metrics on daily new cases during the stages of the epidemic. In the emergent stage, Type 1 and Type 3 metrics are attributed to the daily new cases in longer periods compared with Type 2 mobility. Secondly, our model also shows that the Type 3 mobility metrics had the longest and statistically significant influence on the daily new cases with a surge in the spreading stage and decay during the epidemic and controlled stages. It reflects that people were gradually accepting the social distancing and other NPIs thus reducing the coefficient of Type 3 metrics on daily new Covid-19 cases.
The team is currently developing a model called the Mobility-Augmented Agent-Based Epidemic Model, designed for Covid-19 case reconstruction and simulation. This model leverages monitored Location-Based Services (LBS) mobility data and seroprevalence data as ground truth to guide Agent-Based SEIR simulations, enabling the reconstruction of past Covid-19 case trends and the estimation of future trends in Nigeria. The compartments included in the simulation are illustrated in Figure 5, while key model parameters are presented in Figure 6. Figure 7 shows the interaction between travel behavior modeling and epidemic modeling.
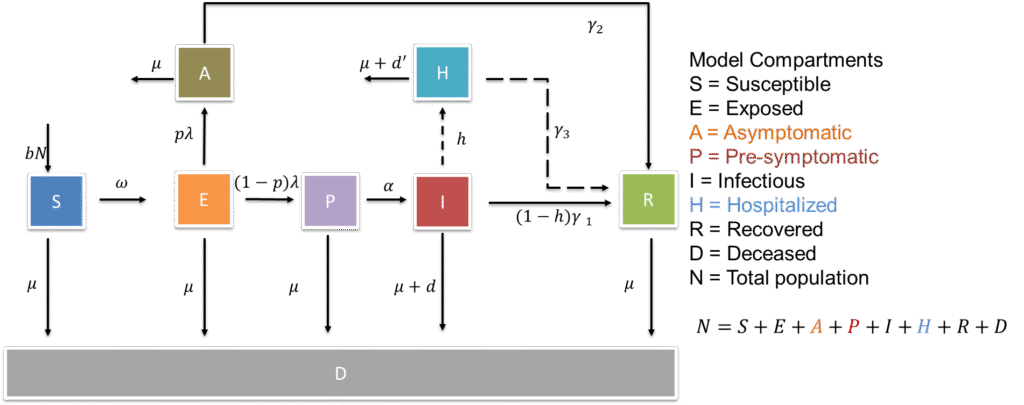
Figure 5. Compartments and variables included in the Agent based SEIR simulation.
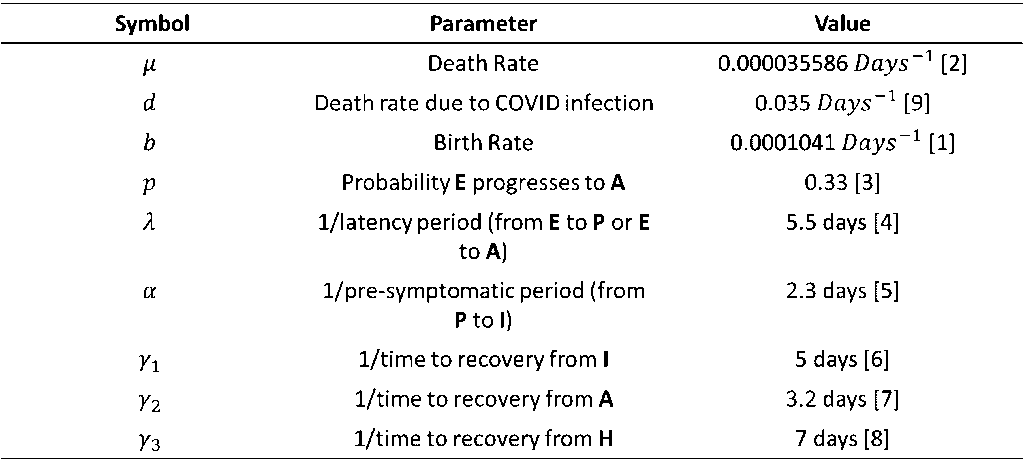
Figure 6. Model parameters for the Agent based SEIR simulation.
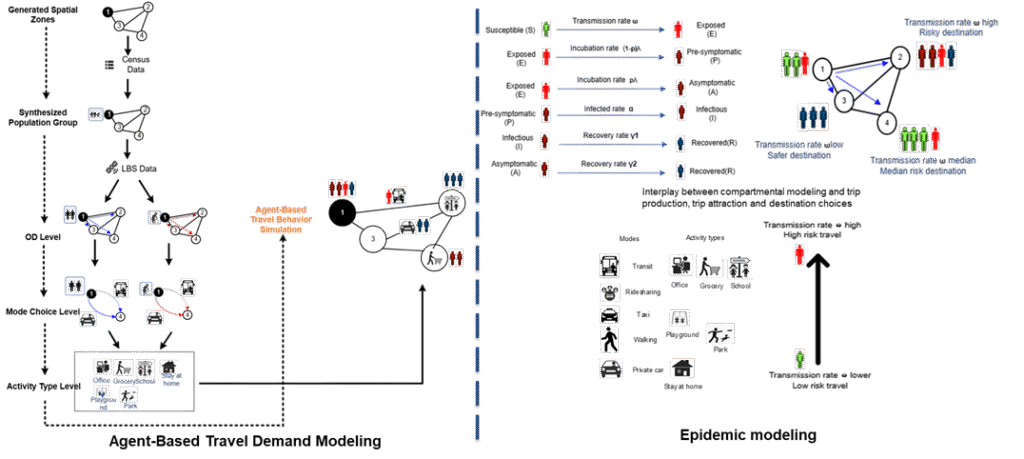
Figure 7. Integration between epidemiological and travel behaviors modeling.
The agent-based model is capable of using agents to simulate the infectious spread of SARS-CoV-2 within confined spaces. With the integration of daily origin-destination (OD) travel data generated through LBS data, the model extends its capability to simulate infection trends across multiple zones (Local Government Areas, LGAs, in Nigeria). This allows for the establishment of infection patterns and case distributions between zones. Furthermore, with the availability of detailed Point of Interest (POI) visit data within LBS datasets, the model can be fine-tuned to incorporate different POIs within each zone, further enhancing its predictive accuracy and policy relevance. The demo simulation has been demonstrated in the Lagos Island in Nigeria with 376 Geohash7 cells (152.9m x 152.4m), as shown in Figure 8.
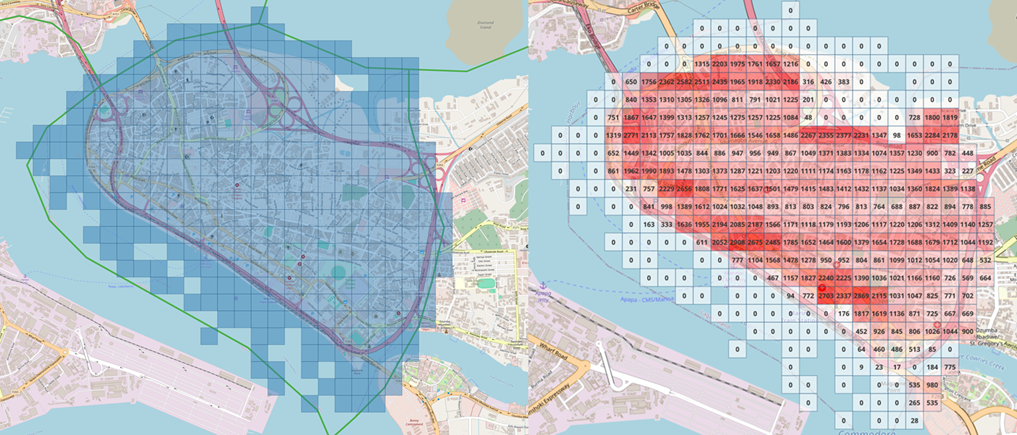
Figure 8. (Left)Simulation area and setup (Right) estimated population distribution across the area
PROJECT 2 ADMINISTRATIVE SUPPLEMENT ON EXTREME WEATHER
This administrative supplement proposal has three specific aims:
- Identify how the risks, cases, and deaths associated with emerging pandemics are related to extreme weather events.
- Identify the change in human movement behaviors as a result of extreme weather events.
- Explore indirect health effects of emerging pandemics like SARS-CoV-2 transmissions and health outcomes due to human movement changes before, during, and after extreme weather events.
PROJECT ACTIVITIES TO SATISFY THE ADMINISTRATIVE SUPPLEMENT AIMS ON EXTREME WEATHER
AIM1: The Villanova team examines the relationship between extreme weather events and SARS-CoV-2 transmission through a series of case studies. The Villanova team conducted a case study in the context of Hurricane Laura, which struck the United States in August 2020. The team integrates diverse data sources, including Covid-19 case numbers, Hurricane track data, human mobility metrics from mobile device locations, and public evacuation orders. The team also conducted another research in the context of Nigeria, aiming at understanding the relationship between extreme weather events and SARS-CoV-2 spread in Africa. The team investigated these correlations using meteorological/hydrological data from Nigeria. The accompanying figure presents an initial analysis of the correlation between precipitation and SARS-CoV-2 spread in 2020.
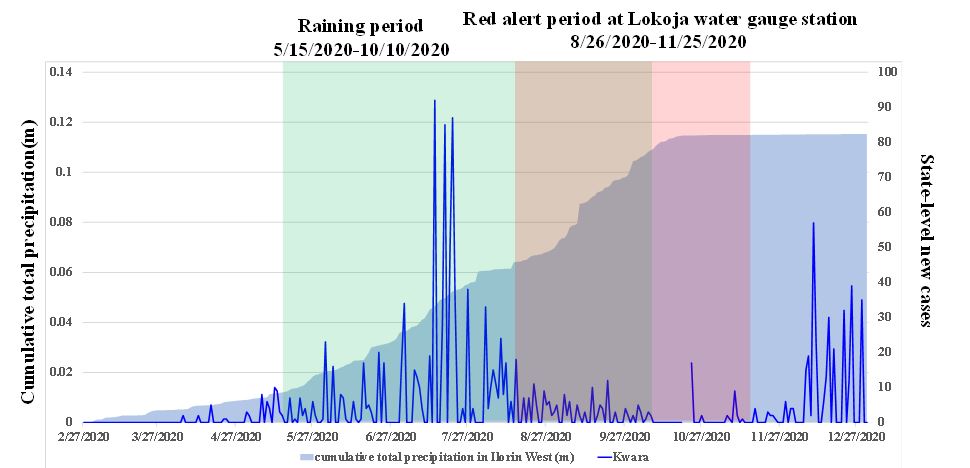
Figure 7. Covid-19 cases in Kwara states and cumulative precipitation in Ilorin West in Nigeria
AIM 2: The Villanova team also conducts studies that delve into changes in human movement behaviors resulting from extreme weather events. These studies use human mobility metrics derived from mobile device locations to quantify these changes. Our analyses began with a US hurricane example (Hurricane Laura) and the methodology was transferred to South Africa and Nigeria with a case study of flooding in Nigeria.
Hurricane Laura case study:
Taking Hurricane Laura as the extreme weather events, the Villanova team conducted an analysis that shows that Hurricane Laura and its associated evacuation orders significantly impacted mobility. The following figure illustrates the evolution of trips per person from Cameron Parish, LA from August 1st to September 15th, 2020. The county was heavily impacted by Hurricane Laura from August 26th to August 27th, as shown in the figure. Notably, there was an increase in total trips on August 24 th and 25 th, 2020, likely due to preparations for the impending hurricane and the mandatory evacuation order issued on August 25 th. Steep drops of trips followed on the 26 th when Hurricane Laura began to impact the county. This increase and decrease in mobility before and during the hurricane are critical for understanding public health dynamics, as it directly influences the spread of infectious diseases like Covid-19.
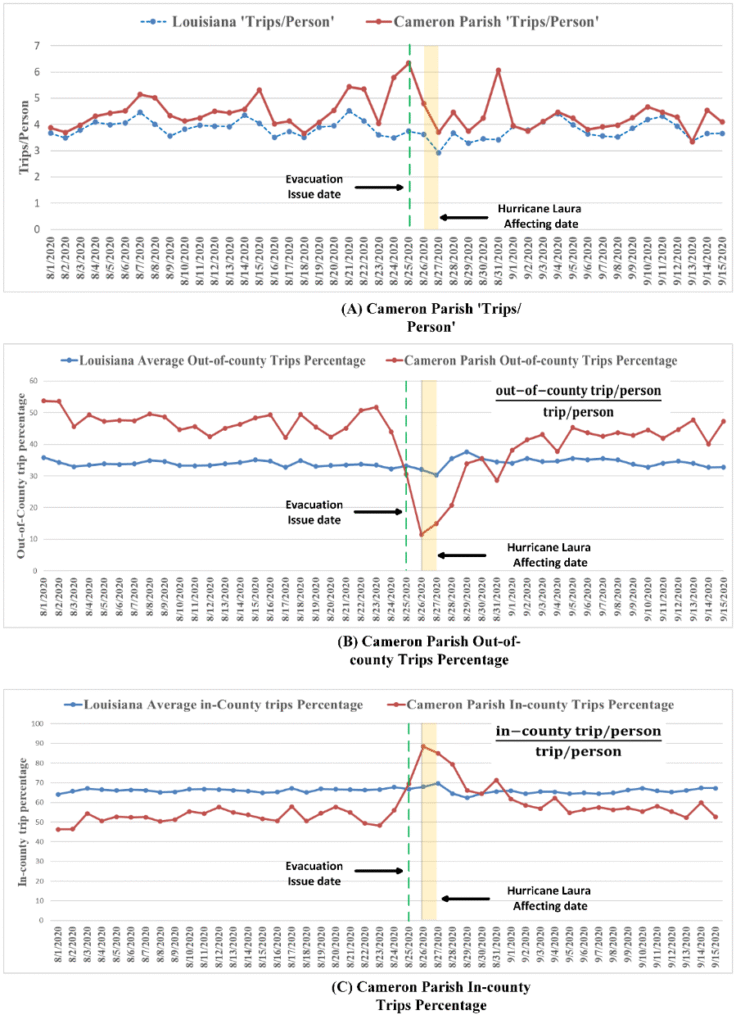
Figure 8. Trip production trends for Cameron County, LA.
The team has also developed a linear mixed-effect model considering all variables associated with evacuation, hurricane, past mobility, and Covid-19. The variables also showed significance in the results. The model includes some demographic variables shown in the following figure.
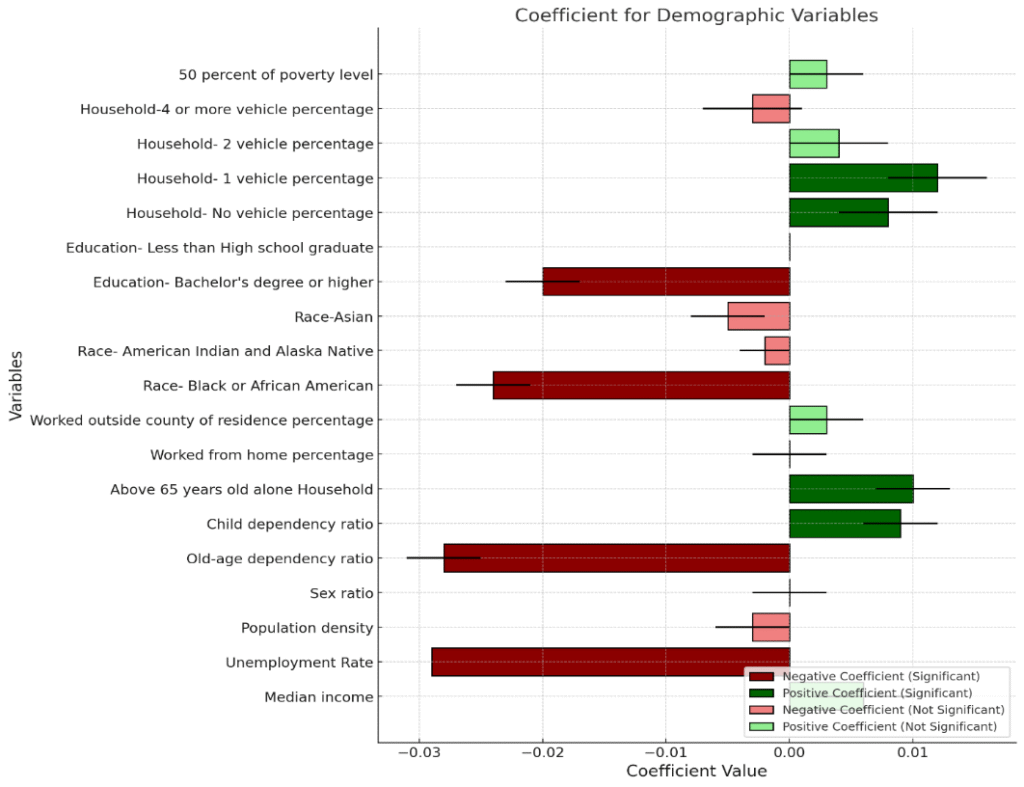
Figure 9. Coefficient plot for demographic variables
Nigeria flooding case study:
In the Lagos Metropolitan Area of Nigeria, the team analyzed the impacts of seasonal flooding on human mobility. The use of Sentinel-1 satellite imagery from the European Space Agency (ESA) enabled the detection of changes in water reflectance over time, identifying areas affected by flooding. This is particularly relevant during the rainy season, which spans from April to October, with peak precipitation levels between June and September. These findings align with the flood mapping results, establishing a clear temporal association between extreme weather events and potential disruptions in human activity that could affect public health.
A Difference-in-Differences (DiD) analysis is conducted to quantify the changes in visits to points of interest (POIs) before and after the flood season, specifically from June to September 2020. The following figures illustrate the complementary relationship between flooding and mobility in the affected area via comparing the distribution of activity points between February and June. The activity points (green) were derived from mobile device location data to represent travel trips. Flooding area (red) was estimated using Google Earth Engine based on Sentinel-1 (SAR) data.
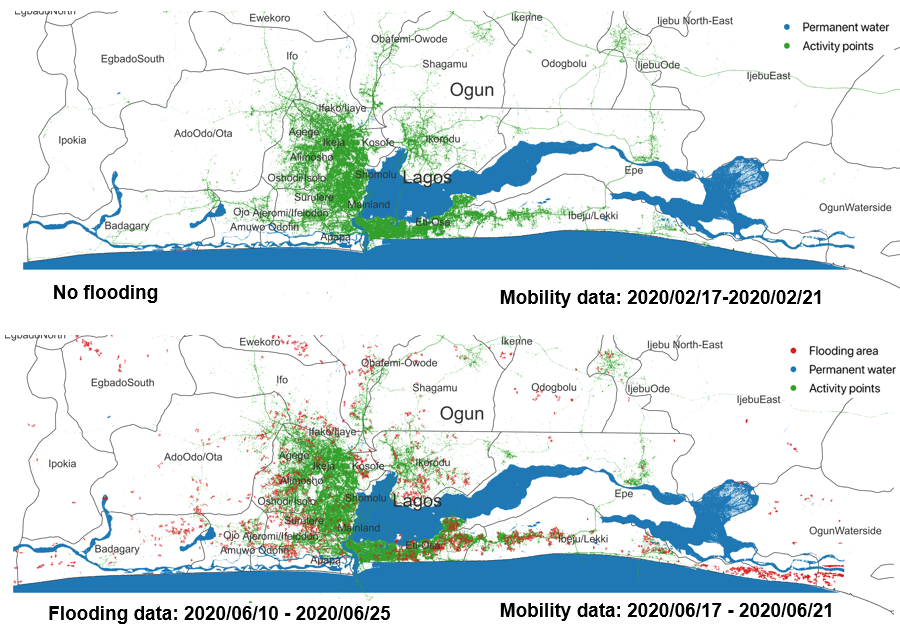
Figure 10. Location-based mobile records and flood inundation mapping in Lagos area
Before conducting the DiD analysis, a preliminary investigation explored the general relationship between flooding and mobility trends. POI geometry information is obtained from an open-source map database (i.e., OpenStreetMap, OSM). Additional data from Google Maps was integrated to supplement missing labels (or tags) and further classify POI categories. To ensure each category has a sufficient amount of data, POI classifications from OSM and Google Maps are consolidated into broader groups. To assess flooding-induced shifts in POI visits during the rainy season, percentage changes in visits across different POI types were visualized over time. The methodology involved mapping activity points onto the geometric boundaries of POIs, calculating daily visit counts for each POI and aggregating POI visits into broader category-level counts.
The estimated changes in POI visits are presented in Figure 11.
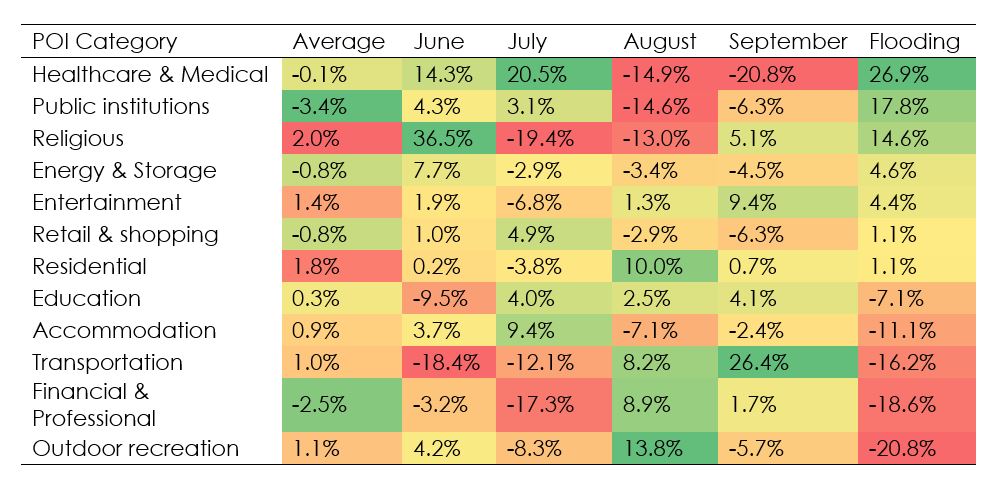
Figure 11. Seasonal variation in POI visits during the rainy season between monthly averages and during flood periods.
The DiD analysis results indicated that, in terms of growth trends, the Residential category experiences the largest numerical increase, while the Healthcare & Medical category shows the highest percentage increase. Conversely, the Education category exhibited the most significant numerical decline, whereas the Outdoor Recreation category had the largest percentage drop. The results of the DiD model are presented in Figure 12.

Figure 12. DiD Estimate and Percentage Change by category before-and-after flooding events on 6-23-2020.
A separate flooding analysis was conducted to quantify the aggregate flooded area at the Local Government Area (LGA) level across Nigeria and assess its impact on human mobility. An algorithm for estimating flooded areas was implemented to observe and calculate the extent of reliably flooded regions. First, the algorithm applied a differential analysis using SAR backscatter values between dry and flooding seasons. Areas with a threshold value of 1.47 were identified as potential flooded areas. Next, permanent and seasonal water bodies were removed from the detected flooded areas. This was achieved using the JRC Global Surface Water Mapping dataset, specifically its “seasonality” measure, to mask out regions where water presence was detected for four or more months of the year. In the next step, a Digital Elevation Model (DEM) from Hydro SHEDS used to filter out areas with slopes greater than 5 percent, as these regions were considered too steep for floodwater to accumulate. Lastly, a connectivity filter was applied, requiring at least 30 connected pixels to ensure the spatial continuity of detected floodwaters, thereby enhancing the accuracy of the flood mapping process.
Figure 13 presents the aggregated flooded area at the LGA level between May 16 and May 31, 2020.
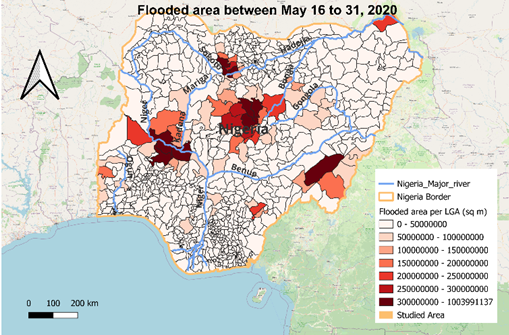
Figure 13. Aggregated flooded area at the LGA level between May 16 and May 31, 2020.
The results of our analysis showed that flooding severity is positively associated with the daily number of trips per person, suggesting that increased flooding may lead to a higher volume of trips. This may be due to individuals evacuating or securing essential supplies. However, the combined effects of flooding severity and daily rainfall exhibit a negative association with trips, reinforcing the restrictive impact of severe weather conditions on travel behaviour.
AIM 3:
We explored the indirect health effects on SARS-CoV-2 transmissions and health outcomes due to changes in human movement around extreme weather events. Employing a two-stage statistical model, the study investigated the direct impact of Hurricane Laura and evacuation orders on the spread of SARS-CoV-2 , and additionally, the indirect impact through changes in mobility metrics. The results indicate that the reduction of travel during flood periods may contribute to a relatively lower number of confirmed Covid-19 cases, suggesting that human mobility can indeed serve as an “intermediate variable” in explaining the relationship between climate events and pandemic evolutions. Moreover, the team identifies spatial demographic variables as significant factors in characterizing the trends of both mobility and Covid-19 cases. These findings highlight the complex interdependencies between demographic characteristics, mobility, and health outcomes, emphasizing the importance of considering these factors in public health planning and response strategies, particularly in scenarios involving extreme weather events and pandemics.
The following figures demonstrate the indirect, approximated effects of hurricane events and associated evacuation orders on future Covid-19 cases. It visualizes the impact on the number of new Covid-19 cases, resulting from the compound risks related to hurricane events and evacuation orders placed from August 23 to August 27. The results reveal mixed outcomes: some counties experienced an increase in case numbers due to evacuation orders (from August 23 th to August 25th), particularly in areas ultimately not affected by the hurricane, while most observed a decrease, attributed to reduced mobility resulting from the hurricane’s impact (August 26 th to August 27 th).
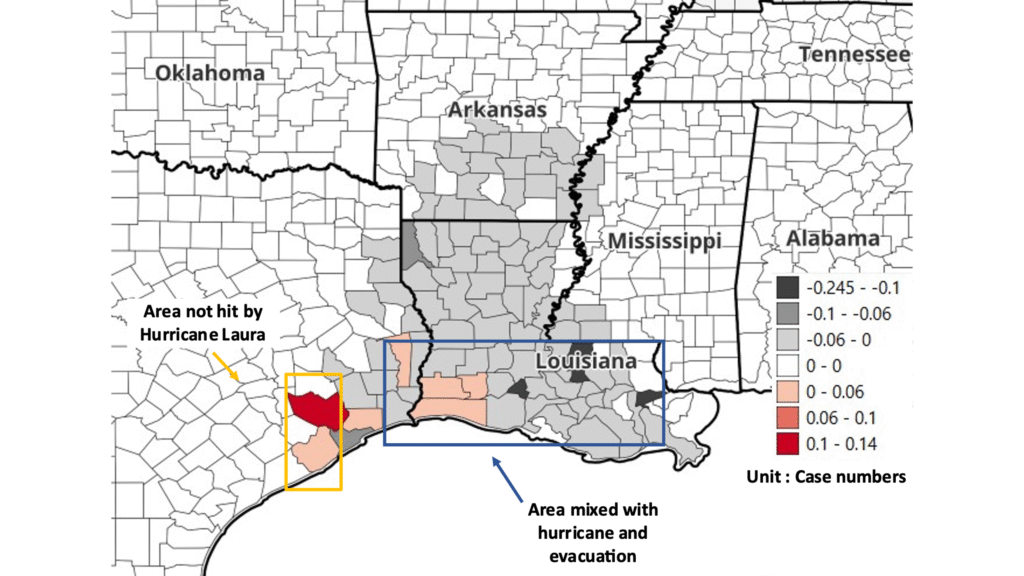
Figure 14. Estimate result on the number of new Covid-19 cases changes.
A separate analysis was conducted to examine the indirect health effects of human movement changes during flooding seasons. The overview of the model framework is shown in Figure 15.
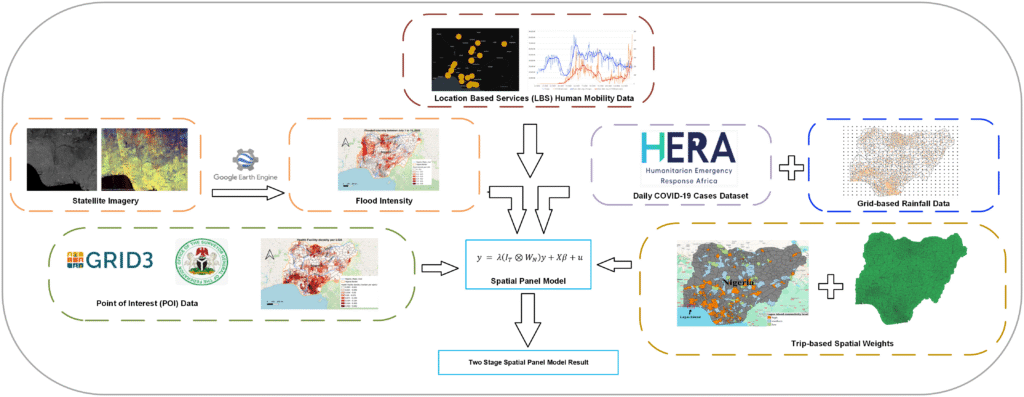
Figure 15. Overview of the model framework.
The findings from both analyses highlight that severe weather and mobility patterns significantly influence the persistence of Covid-19 cases. Additionally, health facility density and GDP are identified as factors contributing to higher reported case counts, likely due to enhanced testing capabilities. This underscores the importance of policymakers considering health resource availability when designing disease-related policies. Areas with better health infrastructure are more equipped to detect and report cases, potentially leading to higher apparent case counts.